
Activity timeline
The Activity page: one date-grouped timeline of scans, deploys, updates, and monitoring events, with CSV and JSON export.
The Activity page (in the sidebar under History) is the project's timeline: everything that happened, in order, on one surface. Where Alerts interrupts you and Issues tracks the work, Activity answers "what happened around then?"
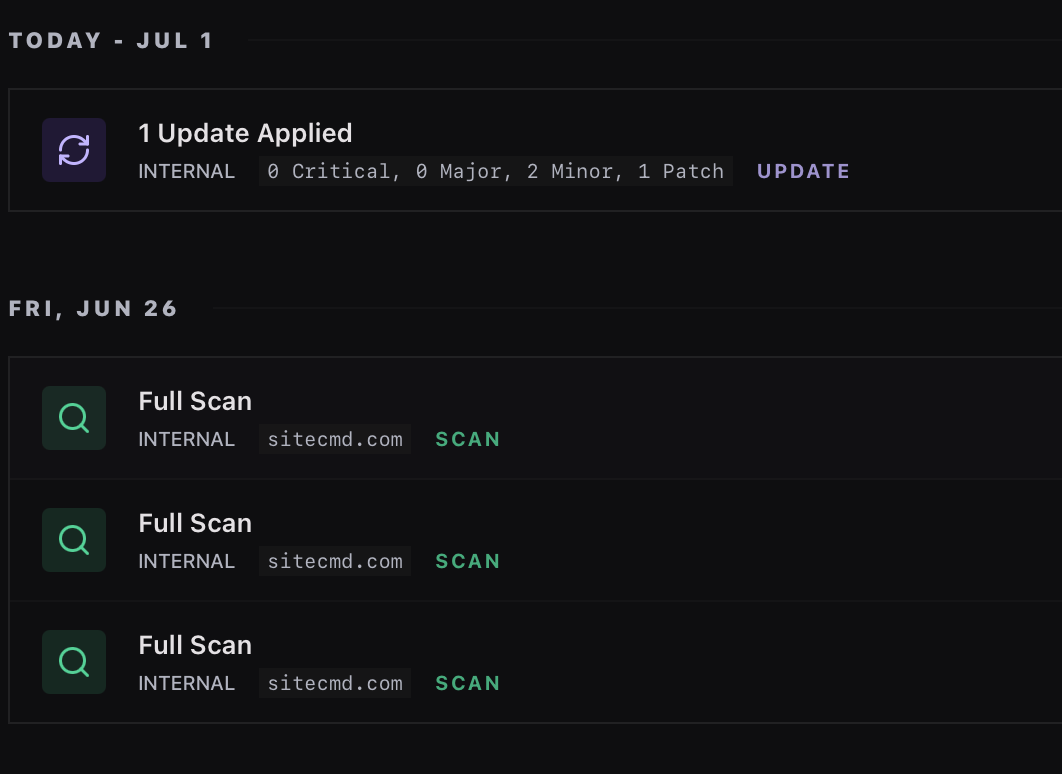
What lands on the timeline
Events are grouped by date and tagged by kind:
- Scans and verification. Every scan run and every fix verification.
- Changes. Deploys and releases (from the GitHub integration) and dependency update refreshes.
- Monitoring. Uptime incidents, traffic anomalies from analytics, and search-performance events from Search Console.
Connected integrations feed their events automatically; without integrations, the timeline still carries your scans, verifications, and update activity. A view switcher swaps the feed for Day, Week, or Month calendar views when you want a specific window laid out in time.
Why a timeline
Correlation by eyeball is underrated. A score drop next to a deploy, a traffic dip next to an uptime incident, an issue's first appearance right after a dependency bump - the timeline puts causes and effects on the same axis. SiteCMD also draws those correlations for you, such as tying a finding to the deploy it followed, while keeping the raw sequence available for inspection.
Filters and export
Filter pills narrow the feed to any combination of the three groups. Export gives you the filtered feed as CSV (for spreadsheets) or JSON (for scripts) - useful for sharing an incident window with someone who doesn't run SiteCMD, or feeding a postmortem.
The desktop timeline is stored in the local database, and exports are written where you choose. Connected-site scans, deployments, and alert operations can send the categories documented in Privacy & data; SiteCMD does not upload the local timeline wholesale.